caffe可视化总结

有时候无法直接观察和查看多层网络,可视化是一个很重要的方法

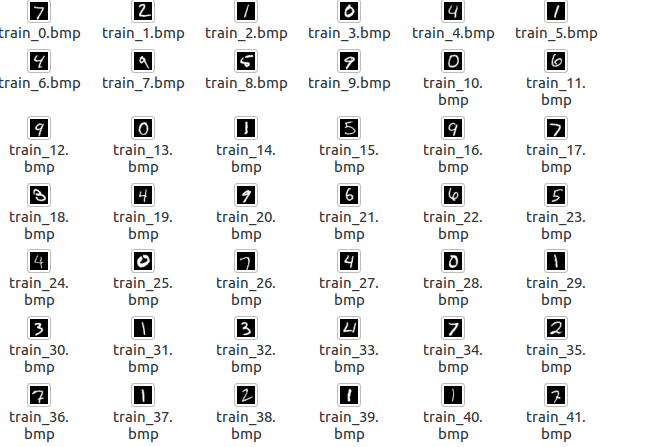
数据可视化

1
2
3
4
5
6
7
8
9
10
11
12
13
14
15
16
17
18
19
20
21
22
import numpy as np
import struct
import matplotlib.pyplot as plt
import Image

filename = 't10k-images-idx3-ubyte'
binfile = open(filename, 'rb')
buf = binfile.read()

index = 0
magic, numImages, numRows, numColumns = struct.unpack_from('>IIII', buf, index)
index += struct.calcsize('>IIII')

for image in range(0, numImages):
im = struct.unpack_from('>784B', buf, index)
index += struct.calcsize('>784B')

im = np.array(im, dtype='uint8')
im = im.reshape(28, 28)

im = Image.fromarray(im)
im.save('data/mnist/mnist_train/train_%s.bmp' % image, 'bmp')


模型可视化

cifar10的网络模型

1
2
cd python
python draw_net.py ../examples/cifar10/cifar10_quick.prototxt cifar10.png

网络权值可视化

​ 对训练后的网络权值进行可视化可以判断模型的优劣及是否欠(过)拟合

经过良好的训练的网络权值通常美观,光滑;反之为噪声图像,或者图案相关性太高,或者缺乏结构性…

进行可视化的代码只需要读取训练后的网络结构和权值文件,将各层的权值数据投影到像素空间.

主程序

1
2
3
4
5
6
7
8
9
10
11
12
13
14
15
16
17
18
clear;
clc;
close all;
addpath('matlab');

caffe.set_mode_cpu();
model_dir = 'models/bvlc_reference_caffenet/';
net_model = [model_dir 'deploy.prototxt'];
net_weights = [model_dir 'bvlc_reference_caffenet.caffemodel'];
phase = 'test'; % run with phase test (so that dropout isn't applied)

% Initialize a network
net = caffe.Net(net_model, net_weights, phase);

param_names={'conv1','conv2','conv3','conv4','conv5'};
for i=1:length(param_names)
visualize_weight(net,param_names{i},1);
end

可视化函数:

1
2
3
4
5
6
7
8
9
10
11
12
13
14
15
16
17
18
19
20
21
22
23
function visualize_weight(net,param_name,space)
w=net.params(param_name,1).get_data();
size(w)
nums=size(w,4);
channels=size(w,3);
width=size(w,2);
count=nums*channels;
n=ceil(sqrt(count));
weight_map=zeros(n*(width+space),n*(width+space),'uint8');
w=w-min(w(:));
w=w/max(w(:))*255;
w=uint8(w);
for i=0:count-1
c=mod(i,n);
r=floor(i/n);
j=mod(i,channels)+1;
k=floor(i/channels)+1;
weight_map(r*(width+space)+(1:width),c*(width+space)+(1:width))=w(:,:,j,k);
end

figure;
imshow(weight_map);
title(param_name);

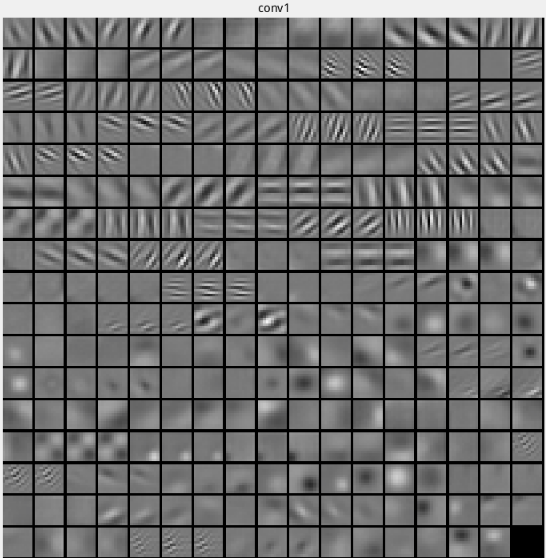
结果:

当然每一个卷积层都可以进行可视化

层的特征可视化

在ipython notebook环境下运行

设置环境

1
2
3
4
5
6
7
8
9
10
11
12
13

import numpy as np
import matplotlib.pyplot as plt
%matplotlib inline

plt.rcParams['figure.figsize'] = (10, 10)
plt.rcParams['image.interpolation'] = 'nearest'
plt.rcParams['image.cmap'] = 'gray'
import sys
caffe_root='./caffe/'
sys.path.insert(0, caffe_root + 'python')

import caffe

下载模型

1
2
3
4
5
6
import os
if os.path.isfile(caffe_root + 'models/bvlc_reference_caffenet/bvlc_reference_caffenet.caffemodel'):
print 'CaffeNet found.'
else:
print 'Downloading pre-trained CaffeNet model...'
!../scripts/download_model_binary.py ../models/bvlc_reference_caffenet

下载网络和输入数据

1
2
3
4
5
6
7
caffe.set_mode_cpu()
model_def = caffe_root + 'models/bvlc_reference_caffenet/deploy.prototxt'
model_weights = caffe_root + 'models/bvlc_reference_caffenet/bvlc_reference_caffenet.caffemodel'

net = caffe.Net(model_def,
model_weights,
caffe.TEST)

下载处理图片

1
2
3
4
5
6
7
8
9
10
11
12
# load the mean ImageNet image (as distributed with Caffe) for subtraction
mu = np.load(caffe_root + 'python/caffe/imagenet/ilsvrc_2012_mean.npy')
mu = mu.mean(1).mean(1) # average over pixels to obtain the mean (BGR) pixel values
print 'mean-subtracted values:', zip('BGR', mu)

# create transformer for the input called 'data'
transformer = caffe.io.Transformer({'data': net.blobs['data'].data.shape})

transformer.set_transpose('data', (2,0,1)) # move image channels to outermost dimension
transformer.set_mean('data', mu) # subtract the dataset-mean value in each channel
transformer.set_raw_scale('data', 255) # rescale from [0, 1] to [0, 255]
transformer.set_channel_swap('data', (2,1,0)) # swap channels from RGB to BGR
1
print net.blobs['data'].data.shape

输出:

1
(1, 3, 227, 227)
1
2
3
4
5
# set the size of the input (we can skip this if we're happy
# with the default; we can also change it later, e.g., for different batch sizes)
net.blobs['data'].reshape(1, # batch size
3, # 3-channel (BGR) images
227, 227) # image size is 227x227
1
2
3
4
# Load an image (that comes with Caffe) and perform the preprocessing we've set up.
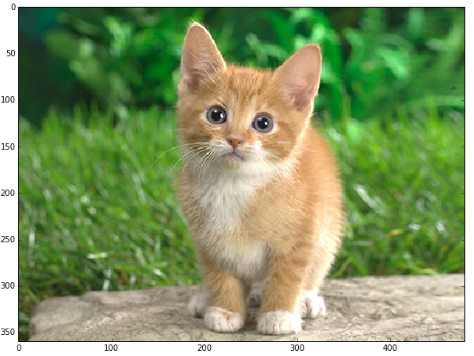
image = caffe.io.load_image(caffe_root + 'examples/images/cat.jpg')
transformed_image = transformer.preprocess('data', image)
plt.imshow(image)

1
2
3
4
5
6
7

net.blobs['data'].data[...] = transformed_image
output = net.forward()

output_prob = output['prob'][0] # the output probability vector for the first image in the batch

print 'predicted class is:', output_prob.argmax()

输出:

1
predicted class is: 281
1
2
3
4
5
6
7
8
# 下载标签
labels_file = caffe_root + 'data/ilsvrc12/synset_words.txt'
if not os.path.exists(labels_file):
!../data/ilsvrc12/get_ilsvrc_aux.sh

labels = np.loadtxt(labels_file, str, delimiter='\t')

print 'output label:', labels[output_prob.argmax()]

output label: n02123045 tabby, tabby cat

1
2
3
# for each layer, show the output shape
for layer_name, blob in net.blobs.iteritems():
print layer_name + '\t' + str(blob.data.shape)

data (1, 3, 227, 227)
conv1 (1, 96, 55, 55)
pool1 (1, 96, 27, 27)
norm1 (1, 96, 27, 27)
conv2 (1, 256, 27, 27)
pool2 (1, 256, 13, 13)
norm2 (1, 256, 13, 13)
conv3 (1, 384, 13, 13)
conv4 (1, 384, 13, 13)
conv5 (1, 256, 13, 13)
pool5 (1, 256, 6, 6)
fc6 (1, 4096)
fc7 (1, 4096)
fc8 (1, 1000)
prob (1, 1000)

1
2
for layer_name, param in net.params.iteritems():
print layer_name + '\t' + str(param[0].data.shape), str(param[1].data.shape)

conv1 (96, 3, 11, 11) (96,)
conv2 (256, 48, 5, 5) (256,)
conv3 (384, 256, 3, 3) (384,)
conv4 (384, 192, 3, 3) (384,)
conv5 (256, 192, 3, 3) (256,)
fc6 (4096, 9216) (4096,)
fc7 (4096, 4096) (4096,)
fc8 (1000, 4096) (1000,)

1
2
3
4
5
6
7
8
9
10
11
12
13
14
15
16
17
18
def vis_square(data):
"""Take an array of shape (n, height, width) or (n, height, width, 3) and visualize each (height, width) thing in a grid of size approx. sqrt(n) by sqrt(n)"""

# normalize data for display
data = (data - data.min()) / (data.max() - data.min())

# force the number of filters to be square
n = int(np.ceil(np.sqrt(data.shape[0])))
padding = (((0, n ** 2 - data.shape[0]),
(0, 1), (0, 1)) # add some space between filters
+ ((0, 0),) * (data.ndim - 3)) # don't pad the last dimension (if there is one)
data = np.pad(data, padding, mode='constant', constant_values=1) # pad with ones (white)

# tile the filters into an image
data = data.reshape((n, n) + data.shape[1:]).transpose((0, 2, 1, 3) + tuple(range(4, data.ndim + 1)))
data = data.reshape((n * data.shape[1], n * data.shape[3]) + data.shape[4:])

plt.imshow(data); plt.axis('off')
1
2
3
4
5
# the parameters are a list of [weights]
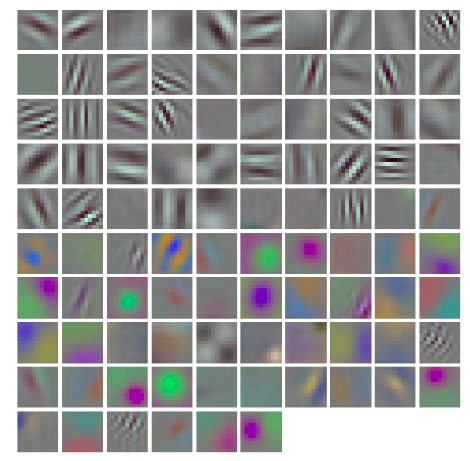
filters = net.params['conv1'][0].data
vis_square(filters.transpose(0, 2, 3, 1))
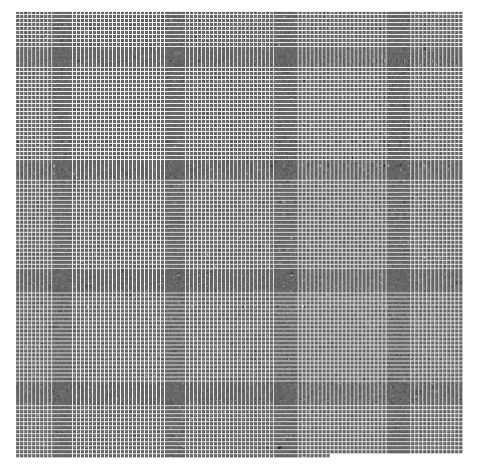
# The first layer output, conv1 (rectified responses of the filters above, first 96 only)
# conv1 (96, 3, 11, 11) (96,)

1
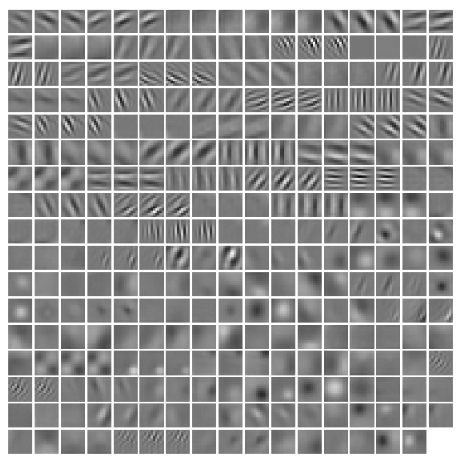
vis_square(filters[:96].reshape(96**3, 11, 11))

1
2
3
4
5
# the parameters are a list of biases
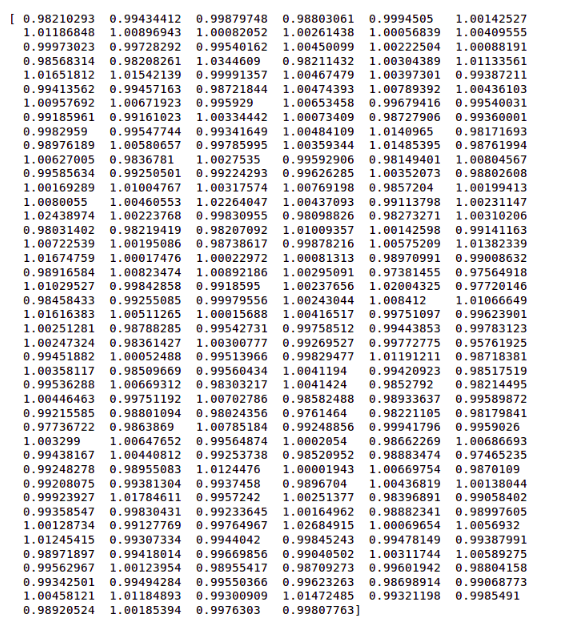
filters_b = net.params['conv1'][1].data
# The first layer output, conv1 (rectified responses of the filters above, first 96 only)
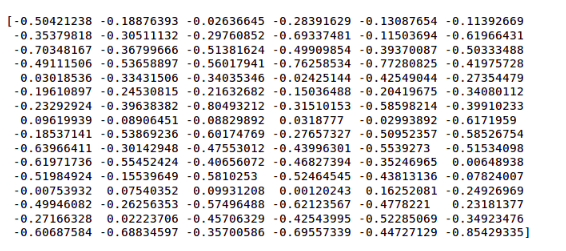
# the params in conv1 is (96, 3, 11, 11) (96,)
print filters_b

1
2
3
4
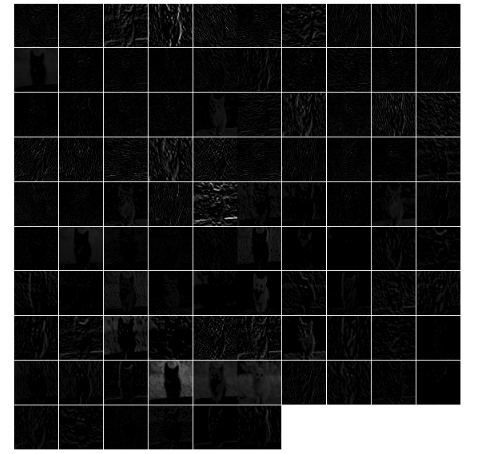
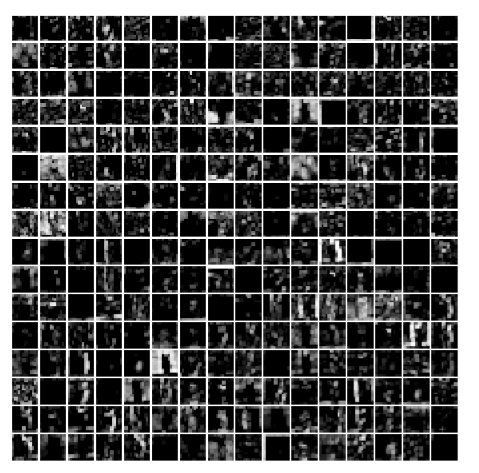
# show the output after conv1 layer
# conv1 (1, 96, 55, 55)
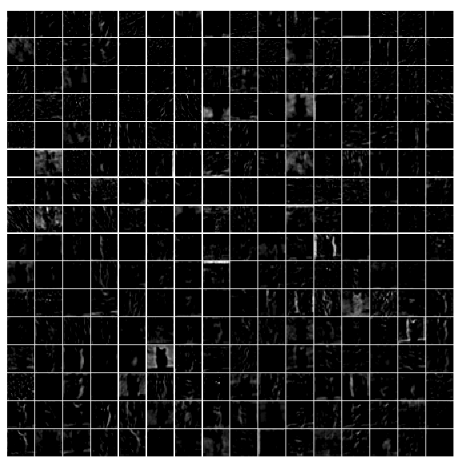
feat = net.blobs['conv1'].data[0]
vis_square(feat)

1
2
3
4
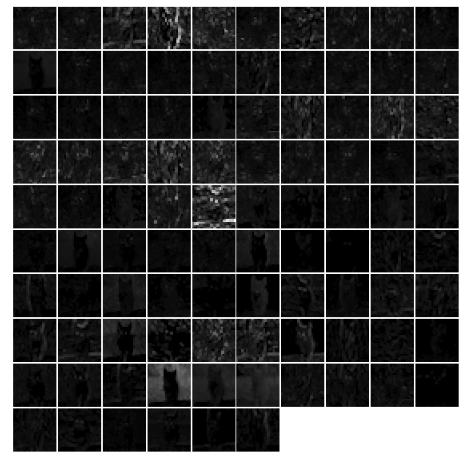
# show the output after pool1 layer
# pool1 (1, 96, 27, 27)
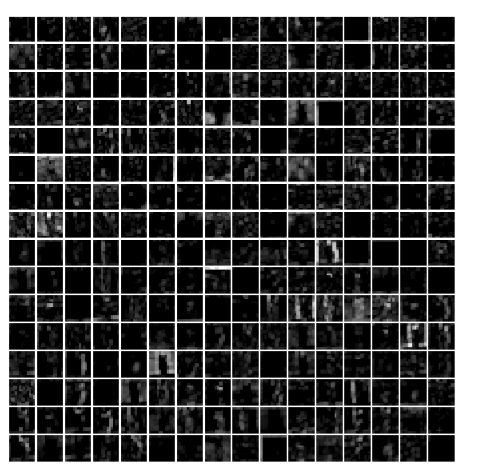
feat = net.blobs['pool1'].data[0]
vis_square(feat)

1
2
3
4
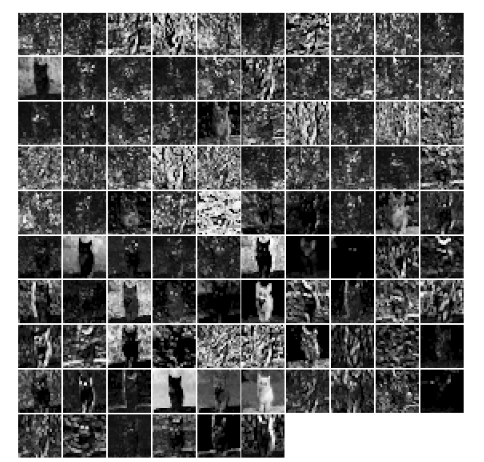
# show the output after norm1 layer
# norm1 (1, 96, 27, 27)
feat = net.blobs['norm1'].data[0]
vis_square(feat)

1
2
3
# the parameters are a list of weights in conv2 layer
filters = net.params['conv2'][0].data
vis_square(filters[:256].reshape(256*48, 5, 5))

1
2
3
4
5
6
7
# the parameters are a list of biases.
filters_b = net.params['conv2'][1].data
# vis_square(filters.transpose(0, 2, 3, 1))

# The first layer output, conv1 (rectified responses of the filters above, first 96 only)
print filters_b
conv2 (256, 48, 5, 5) (256,)

1
2
3
4
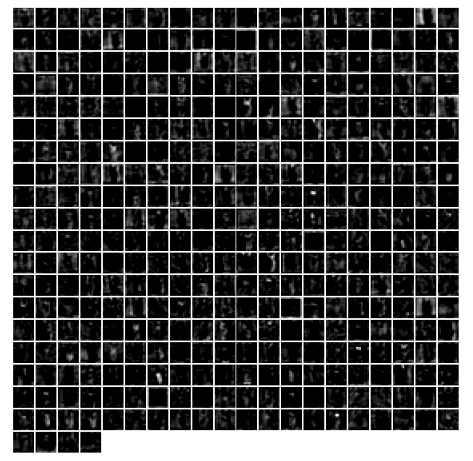
# show the result after conv2
feat = net.blobs['conv2'].data[0]
vis_square(feat)
# conv2 (1, 256, 27, 27)

1
2
3
4
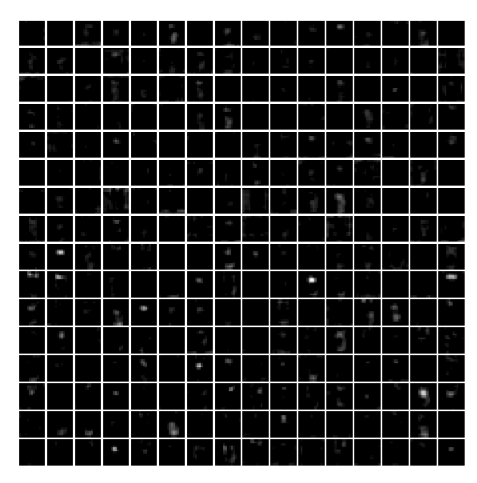
# show the result after pooling2
feat = net.blobs['pool2'].data[0]
vis_square(feat)
# pool2 (1, 256, 13, 13)

1
2
3
4
# show the result after LRN 
feat = net.blobs['norm2'].data[0]
vis_square(feat)
# norm2 (1, 256, 13, 13)

1
2
3
4
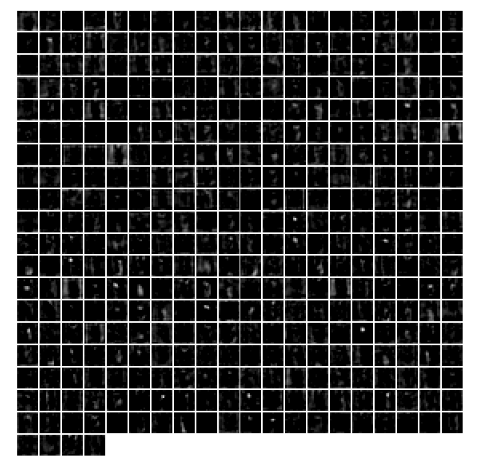
# show the result after conv3
feat = net.blobs['conv3'].data[0]
vis_square(feat)
# conv3 (1, 384, 13, 13)

1
2
3
4
# show the result after conv4
feat = net.blobs['conv4'].data[0]
vis_square(feat)
# conv4 (1, 384, 13, 13)

1
2
3
4
# show the result after conv5
feat = net.blobs['conv5'].data[0]
vis_square(feat)
# conv5 (1, 256, 13, 13)

1
2
3
4
# show the result after pooling layer 5
feat = net.blobs['pool5'].data[0]
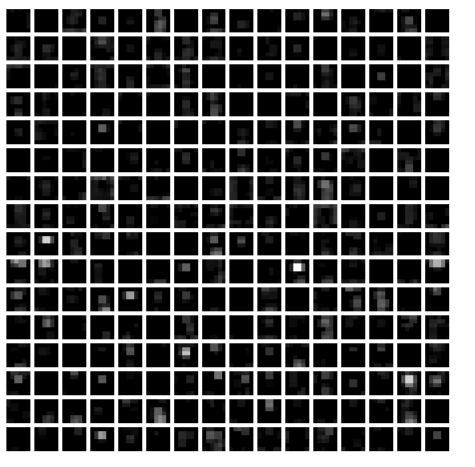
vis_square(feat)
# pool5 (1, 256, 6, 6)

1
2
3
4
5
6
7
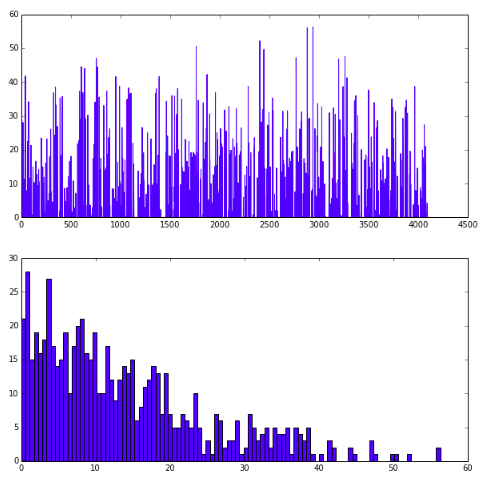
# show the result after fc6 layer
feat = net.blobs['fc6'].data[0]
plt.subplot(2, 1, 1)
plt.plot(feat.flat)
plt.subplot(2, 1, 2)
_ = plt.hist(feat.flat[feat.flat > 0], bins=100)
# fc6 (1, 4096)

1
2
3
4
5
6
7
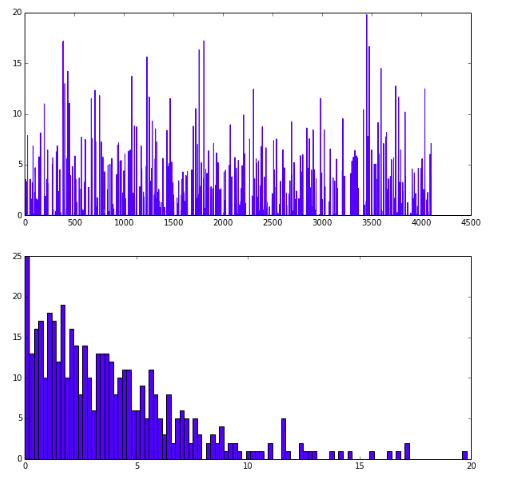
# show the result after fc7
feat = net.blobs['fc7'].data[0]
plt.subplot(2, 1, 1)
plt.plot(feat.flat)
plt.subplot(2, 1, 2)
_ = plt.hist(feat.flat[feat.flat > 0], bins=100)
# fc7 (1, 4096)

1
2
3
4
5
6
7
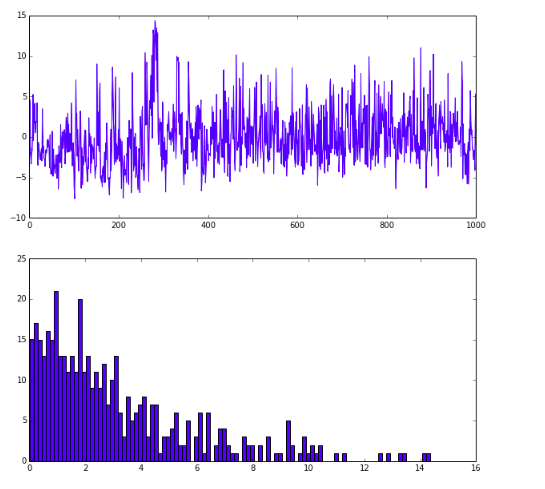
# show the result after fc8
feat = net.blobs['fc8'].data[0]
plt.subplot(2, 1, 1)
plt.plot(feat.flat)
plt.subplot(2, 1, 2)
_ = plt.hist(feat.flat[feat.flat > 0], bins=100)
# fc8 (1, 1000)

1
2
3
4
5
# show the result after prob layer
feat = net.blobs['prob'].data[0]
plt.figure(figsize=(15, 3))
plt.plot(feat.flat)
# prob (1, 1000)

Loss 和accuracy可视化

1
2
3
4
5
6
7
8
9
10
11
12
13
import numpy as np
import matplotlib.pyplot as plt
%matplotlib inline
import sys,os,caffe
#设置当前目录
caffe_root = '/home/caffe/'
sys.path.insert(0, caffe_root + 'python')
os.chdir(caffe_root)

# set the solver prototxt
caffe.set_device(0)
caffe.set_mode_gpu()
solver = caffe.SGDSolver('examples/cifar10/cifar10_quick_solver.prototxt')

​ 如果不需要绘制曲线,只需要训练出一个caffemodel, 直接调用solver.solve()就可以了。如果要绘制曲线,就需要把迭代过程中的值

保存下来,因此不能直接调用solver.solve(), 需要迭代。在迭代过程中,每迭代200次测试一次

1
2
3
4
5
6
7
8
9
10
11
12
13
14
15
16
17
18
%%time
niter =4000
test_interval = 200
train_loss = np.zeros(niter)
test_acc = np.zeros(int(np.ceil(niter / test_interval)))

# the main solver loop
for it in range(niter):
solver.step(1) # SGD by Caffe

# store the train loss
train_loss[it] = solver.net.blobs['loss'].data
solver.test_nets[0].forward(start='conv1')

if it % test_interval == 0:
acc=solver.test_nets[0].blobs['accuracy'].data
print 'Iteration', it, 'testing...','accuracy:',acc
test_acc[it // test_interval] = acc

Iteration 0 testing… accuracy: 0.10000000149

Iteration 200 testing… accuracy: 0.419999986887

Iteration 400 testing… accuracy: 0.479999989271

Iteration 600 testing… accuracy: 0.540000021458

Iteration 800 testing… accuracy: 0.620000004768

Iteration 1000 testing… accuracy: 0.629999995232

Iteration 1200 testing… accuracy: 0.649999976158

Iteration 1400 testing… accuracy: 0.660000026226

Iteration 1600 testing… accuracy: 0.660000026226

Iteration 1800 testing… accuracy: 0.670000016689

Iteration 2000 testing… accuracy: 0.709999978542

Iteration 2200 testing… accuracy: 0.699999988079

Iteration 2400 testing… accuracy: 0.75

Iteration 2600 testing… accuracy: 0.740000009537

Iteration 2800 testing… accuracy: 0.769999980927

Iteration 3000 testing… accuracy: 0.75

Iteration 3200 testing… accuracy: 0.699999988079

Iteration 3400 testing… accuracy: 0.740000009537

Iteration 3600 testing… accuracy: 0.72000002861

Iteration 3800 testing… accuracy: 0.769999980927

1
2
3
4
5
6
7
8
print test_acc
_, ax1 = plt.subplots()
ax2 = ax1.twinx()
ax1.plot(np.arange(niter), train_loss)
ax2.plot(test_interval * np.arange(len(test_acc)), test_acc, 'r')
ax1.set_xlabel('iteration')
ax1.set_ylabel('train loss')
ax2.set_ylabel('test accuracy')